

After moving the computer I use for Home Assistant (HA) into a closed cabinet, I felt it was a good time to add computer temperature monitoring & recording to my Home Assistant server. Most tutorials and suggestions I’ve seen to add temperature monitoring involve implementing the command_line platform in Home Assistant and using the command: cat /sys/class/thermal/thermal_zone0/temp, with the full HA platform looking something like this:
- platform: command_line
  name: CPU Temp
  command: "cat /sys/class/thermal/thermal_zone0/temp"
  unit_of_measurement: "°C"
  value_template: '{{ value | multiply(0.001) | round(0)}}'
This is great if you’re running something like Hass.io on a Raspberry Pi. However, this method does not work when running Home Assistant in a virtual machine (VM) on Proxmox, as the VM does not have access to the integrated temperature sensors. I needed another solution which is where I discovered Telegraf (https://www.influxdata.com/time-series-platform/telegraf/)
Telegraf is a plugin-driven server agent for collecting and sending metrics and events from databases, systems, and IoT sensors
Telegraf an incredibly powerful tool for data collection from the creators of InfluxDB. It also is a great way to gather our computer temperatures and send them to Home Assistant with MQTT. Here’s how I did it:
Step-by-Step Guide
1. Open up your Proxmox Node’s Shell. Make sure you are opening the Node’s shell and not the VM console. Also as a disclaimer: When working in this shell, you are running as root, and you are directly editing the Proxmox Hypervisor. I haven’t had any issues, but you should do this at your own risk!

2. We’re first going to need to install a plugin that can extract the computer temperature sensors, called lm-sensors. This will get us the CPU temperatures and, depending on your system, other sensor data such as voltages and fan rotation speeds. To install and setup lm-sensors, run these commands:
apt-get install lm-sensors
sensors-detect
The sensors-detect command will walk you through detecting the sensors in your system (usually you should be okay to saying yes to all steps during this identification). Afterwards, to test to make sure the discovered sensors are working, run the command:
watch -n 1 sensorsDepending on what sensors were found, the output of that command should look something like this:

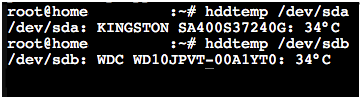
3. I also wanted to get my HDD and SSD card temperatures. To do this, I needed to install the plugin hddtemp, which will give us the temperatures via S.M.A.R.T. To install, use the command:
apt-get install hddtempAfter installing, you should be able to run a command such as, hddtemp /dev/sda or hddtemp /dev/sdb to get the temperatures of your drives (depending on how the drives are mounted, they may not be located at sda or sdb).
After testing hddtemp, we need to edit its configuration file to allow us to connect it to Telegraf. Edit the file located at /etc/default/hddtemp. You can do this by running the command:
nano /etc/default/hddtempThen, find the line that says: RUN_DAEMON="false" and change it to RUN_DAEMON="true". If you’re using the nano editor, save the changes you’ve made (Ctrl + O) , and exit nano (Ctrl + X). After, run the commands below, to use the updated configuration:
service hddtemp restart
service hddtemp start
4. Now we are ready to install Telegraf. The latest installation instructions are available here: https://docs.influxdata.com/telegraf/v1.14/introduction/installation/. Since we are installing on Proxmox, follow the Debian installation instructions. And, since we are doing this as root, remove sudo from the listed commands on the installation site.
5. After installation, we need to edit the Telegraf configuration file, telegraf.conf located in the directory: /etc/telegraf/. At the time of writing this, the default Telegraf configuration file is over 6600 lines! While you can edit it in something like nano, I’d recommend downloading the file, making a backup, and then uploading the edited configuration. (I would also recommend skimming through this file to see all of the potential integrations, and potential new projects!).
However, if you just want CPU and HDD temps, then for this guide, we only want the input plugins for hddtemp and sensors. If you would like to edit the main file yourself, you are going to uncomment (remove the #’s) the sections[[inputs.hddtemp]] and [[inputs.sensors]] to get the temperature data. And, to use MQTT, uncomment the [[outputs.mqtt]]section. If you just want a simple configuration file to modify and replace, a condensed configuration file that you can edit is below:
# Telegraf Configuration
[global_tags]
[agent]
  interval = "60s"  ## Default data collection interval for all inputs
  round_interval = true
  metric_batch_size = 1000
  metric_buffer_limit = 10000
  collection_jitter = "0s"
  flush_interval = "10s"
  flush_jitter = "5s"
  precision = ""
  hostname = "##ADD Home Assistant SERVER IP HERE##"
  omit_hostname = false
##########################################################
#                           OUTPUT PLUGINS
##########################################################
### Configuration for MQTT server to send metrics to
[[outputs.mqtt]]
  servers = ["##ADD MQTT SERVER IP HERE##:1883"] # required.
  topic_prefix = "telegraf"
  qos = 2

### username and password to connect MQTT server.
  username = "##ADD MQTT USERNAME HERE##"
  password = "##ADD MQTT PASSWORD HERE##"
  retain = false
  data_format = "json"
#########################################################
#                            INPUT PLUGINS
#########################################################
### Monitor disks' temperatures using hddtemp
[[inputs.hddtemp]]
  address = "127.0.0.1:7634"
  devices = ["sda"] ##Depending on which HDD are connected, you may need to change these
### Monitor sensors, requires lm-sensors package
[[inputs.sensors]]
    timeout = "5s"
Edit the sections listed:
- ADD Home Assistant SERVER IP HERE
- ADD MQTT SERVER IP HERE
- ADD MQTT USERNAME HERE
- ADD MQTT PASSWORD HERE
- And change the “sda” under devices in hddtemp if required
If you’re using the Home Assistant Add-on: Mosquitto Broker, then the MQTT server IP is likely your Home Assistant IP, and your MQTT username and password can be found in its configuration:

6. Now we are ready to test if Telegraf is working and sending our data to the MQTT server. Run the command telegraf and monitor the output. If there’s no errors, then we can head over to our Home Assistant server and see if it’s receiving the data. If you used the provided configuration above, the data will come in through MQTT with the topic “telegraf”.
If you can see the data in HA, then we can now use it to create a sensor. In the Telegraf output, we are sending the data in a json format. You should be able to create a MQTT sensor in Home Assistant (https://www.home-assistant.io/integrations/sensor.mqtt/), to parse the data and create sensors for the different components. However, I personally use NodeRED for my automations, so I created the sensors in there. The next tutorial will involve taking this data and parsing it in NodeRED to create sensors in Home Assistant.
Conclusion
7. Finally, if everything is working, we can enable the Telegraf service using systemctl. Run the command:
systemctl enable --now telegraf
systemctl is-enabled telegraf
systemctl start telegraf
systemctl status telegraf
The command, systemctl is-enabled telegraf should say “enabled”, and the command, systemctl status telegraf should say “active (running)”.
We can now get the temperatures from our host machine, into Home Assistant!
